01
The average order value formula
AOV equals order revenue divided by completed orders for the same period.
Divide revenue by orders, then model what the same order count would produce at a deliberate target AOV.
Average order value
$50.00Descriptive basket metric for the entered period; the target scenario holds order count constant and does not predict lift.ONE BASKET SIGNAL
Revenue and completed orders must cover the same window, currency, channels, and cancellation treatment before the ratio means anything.
THE FIELD NOTES
Use the result now, then read the practical notes for assumptions, examples, limitations, and the choices behind it.
$12,500 scenario difference at a $55 target
AOV equals order revenue divided by completed orders for the same period.
Mixing gross revenue with net orders creates a misleading ratio.
The target panel holds order count constant to isolate the arithmetic revenue difference.
Seasonality, product mix, promotions, and channel composition can move AOV without a structural change.
THE PRODUCT IS NEXT
AOV equals order revenue divided by completed orders for the same period.
It is a basket-size measure, not profit or customer lifetime value.
Mixing gross revenue with net orders creates a misleading ratio.
Document how refunds, tax, shipping, and canceled orders are treated before comparing periods.
The target panel holds order count constant to isolate the arithmetic revenue difference.
It does not predict demand, conversion, or the effect of merchandising changes.
Seasonality, product mix, promotions, and channel composition can move AOV without a structural change.
Use the same definition and period length before drawing a trend conclusion.
Divide order revenue by the number of completed orders in the same reporting period.
Use the definition your reporting system applies and keep it consistent across periods; document the scope when comparing benchmarks.
No. Discounts, product mix, fulfillment, returns, and acquisition costs can change profit even when AOV rises.
BUILT BY LOOK ATLAS
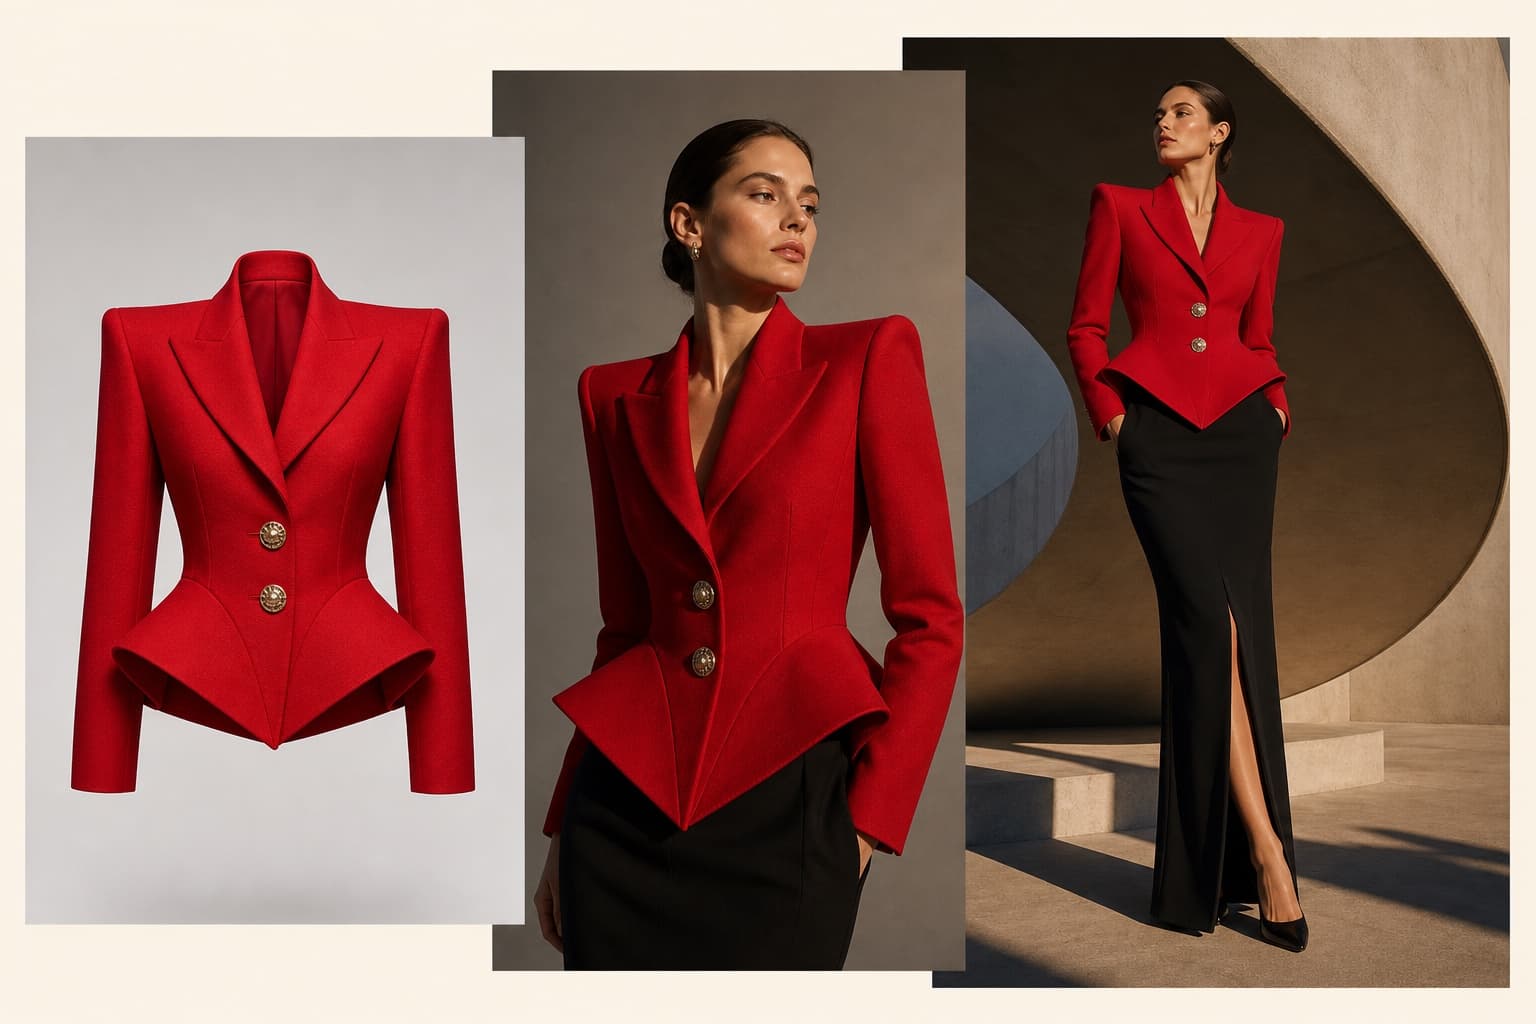
Turn a simple product photo into polished, campaign-ready creative for your store, ads, and social channels. No studio. No reshoots.
Create your first shoot free, then keep going when you’re ready.